Tutorial 7: Operations with peaks
The peak list can be modified using the mlgidGUI. This interactive interface allows users to visualize, adjust, and save peak selections directly to a NeXus file.
In addition, mlgidBASE provides basic functionality to delete and add peaks. First, run the analysis:
from mlgidbase import mlgidBASE
filename = '../../example/BA2PbI4.h5'
analysis = mlgidBASE(filename=filename)
analysis.run_detection()
analysis.run_fitting()
analysis.run_matching(
    cif_prepr = r'../../example/prepr_cifs.pickle',
    peaks_type='segments')

analysis.run_matching(
    cif_prepr = r'../../example/prepr_cifs.pickle',
    peaks_type='rings')
2026-07-21 15:48:06.585488598 [W:onnxruntime:Default, device_discovery.cc:283 GetGpuDevices] Failed to detect devices under "/sys/class/drm/card0": device_discovery.cc:93 ReadFileContents Failed to open file: "/sys/class/drm/card0/device/vendor"
INFO - Loading model
---------------------------------------------------------------------------
InvalidProtobuf                           Traceback (most recent call last)
File ~/checkouts/readthedocs.org/user_builds/mlgidbase/envs/latest/lib/python3.11/site-packages/mlgidbase/mlgiddetect_functions.py:68, in load_inference(analysis)
     67 try:
---> 68     analysis.imp_detect = Inference(analysis.config_detect)
     69 except:

File ~/checkouts/readthedocs.org/user_builds/mlgidbase/envs/latest/lib/python3.11/site-packages/mlgiddetect/inference/inference.py:32, in Inference.__init__(self, config)
     31     sess_options.intra_op_num_threads = 1
---> 32 self.sess = rt.InferenceSession(model_path, providers=preferred_providers, sess_options=sess_options)

File ~/checkouts/readthedocs.org/user_builds/mlgidbase/envs/latest/lib/python3.11/site-packages/onnxruntime/capi/onnxruntime_inference_collection.py:528, in InferenceSession.__init__(self, path_or_bytes, sess_options, providers, provider_options, **kwargs)
    527 try:
--> 528     self._create_inference_session(providers, provider_options, disabled_optimizers)
    529 except (ValueError, RuntimeError) as e:

File ~/checkouts/readthedocs.org/user_builds/mlgidbase/envs/latest/lib/python3.11/site-packages/onnxruntime/capi/onnxruntime_inference_collection.py:623, in InferenceSession._create_inference_session(self, providers, provider_options, disabled_optimizers)
    622 if self._model_path:
--> 623     sess = C.InferenceSession(session_options, self._model_path, True, self._read_config_from_model)
    624 else:

InvalidProtobuf: [ONNXRuntimeError] : 7 : INVALID_PROTOBUF : Load model from /home/docs/.local/share/mlgiddetect/dino.onnx failed:Protobuf parsing failed.

During handling of the above exception, another exception occurred:

ValueError                                Traceback (most recent call last)
Cell In[1], line 4
      1 from mlgidbase import mlgidBASE
      2 filename = '../../example/BA2PbI4.h5'
      3 analysis = mlgidBASE(filename=filename)
----> 4 analysis.run_detection()
      5 analysis.run_fitting()
      6 analysis.run_matching(
      7     cif_prepr = r'../../example/prepr_cifs.pickle',

File ~/checkouts/readthedocs.org/user_builds/mlgidbase/envs/latest/lib/python3.11/site-packages/mlgidbase/main.py:194, in mlgidBASE.run_detection(self, entry, frame_num, config_detect, model_type)
    179 def run_detection(self, entry=None, frame_num=None, config_detect=None, model_type=None):
    180     """
    181     Run peak detection on the dataset.
    182
   (...)    192         Type of detection model to use (e.g., 'faster_rcnn', 'dino').
    193     """
--> 194     _run_detection(self, entry, frame_num, config_detect, model_type)

File ~/checkouts/readthedocs.org/user_builds/mlgidbase/envs/latest/lib/python3.11/site-packages/mlgidbase/mlgiddetect_functions.py:48, in _run_detection(analysis, entry, frame_num, config_detect, model_type)
     43 # if model_type is not None:
     44 #     if analysis.config_detect.MODEL_TYPE != model_type:
     45 #         analysis.config_detect.MODEL_TYPE = model_type
     46 #         analysis.imp_detect = None
     47 if analysis.imp_detect is None:
---> 48     load_inference(analysis)
     50 if not analysis.from_nexus:
     51     if frame_num != 1 and not frame_num is None:

File ~/checkouts/readthedocs.org/user_builds/mlgidbase/envs/latest/lib/python3.11/site-packages/mlgidbase/mlgiddetect_functions.py:70, in load_inference(analysis)
     68     analysis.imp_detect = Inference(analysis.config_detect)
     69 except:
---> 70     raise ValueError("Detection failed. Couldn't load the model.")

ValueError: Detection failed. Couldn't load the model.
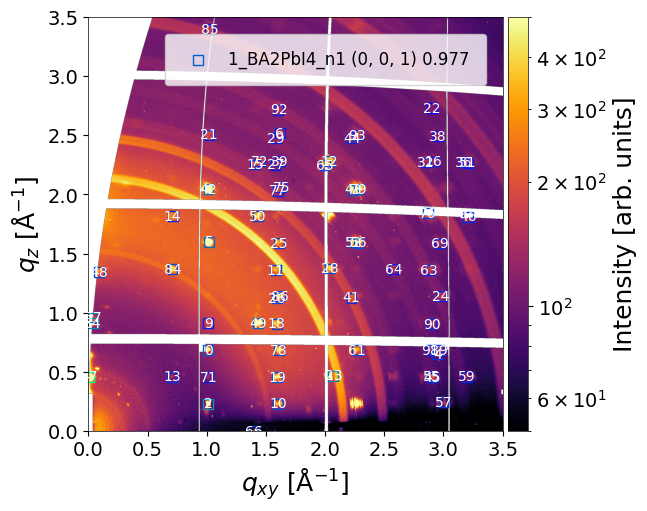
Segments
Visualize the matched peaks
# Visualization settings for matched peaks (multiple structures in solution)
matched_params = {
    'solution': None,              # list of structures to display (None = all)
    'plot_segments': True,         # show matched peak positions
    'marker': ['s', 's', 's'],     # marker shapes for each structure
    'marker_size': [50, 50, 50],   # marker sizes for each structure
    'marker_facecolor': ["none", "none", "none"],  # marker fill colors
    'marker_edgecolor': ["winter", 'blue', 'green'], # marker edge colors per structure
    'plot_rings': False,            # draw matched rings
    'line_width': [1, 1, 1],       # line widths for each structure
    'line_style': ["--", "--", "--"], # line styles for each structure
    'line_color': ["bone", 'blue', 'bone'], # line colors per structure
    'plot_id': True,              # display peak IDs
    'text_color': 'white',         # color of ID labels
    'text_size': 10,                # font size of ID labels
    'legend': True,                # show legend for multiple structures
    'plot': True,                 # enable/disable plotting of matched peaks
}

# Plot analysis results with selected matched peak visualization
analysis.plot_analysis_results(
    matched_params=matched_params,
    entry='entry_0000',  # select entry
    frame_num=0,          # select frame
    clims=(50, 5e2),     # color map
)

Delete the peak #94
analysis.delete_peak(
    entry='entry_0000',
    frame_num=0,
    peak_id=94 # peak number
)
The peak dissapears from all: detected, fitted and matched (all solutions and structures) peak lists.
analysis.plot_analysis_results(
    matched_params=matched_params,
    entry='entry_0000',  # select entry
    frame_num=0,          # select frame
    clims=(50, 5e2),     # color map
)
Add a box for the missing peak at q_xy = 2.25, q_z=2.5. NOTE: it appears only in detected peaks
analysis.add_peak(
    entry='entry_0000',
    frame_num=0,
    q_xy = 2.25, # box center in horizontal direction (Å⁻¹)
    dq_xy=0.1,   # box wight in horizontal direction (Å⁻¹)
    q_z=2.5,     # box center in vertical direction (Å⁻¹)
    dq_z=0.06    # box wight in vertical direction (Å⁻¹)
)
INFO - Peak id#93 has been added
Run fitting and matching:
analysis.run_fitting()
analysis.run_matching(
    cif_prepr = r'../../example/prepr_cifs.pickle',
    peaks_type='segments')

analysis.run_matching(
    cif_prepr = r'../../example/prepr_cifs.pickle',
    peaks_type='rings')
INFO - Saved fitted peaks to file: ../../example/BA2PbI4.h5, entry: entry_0000, frame: 0
INFO - cif_prepr is already set. The previous cif_prepr is to be used
INFO - Saved matched peaks to file: ../../example/BA2PbI4.h5, entry: entry_0000, frame: 0
INFO - cif_prepr is already set. The previous cif_prepr is to be used
INFO - Saved matched peaks to file: ../../example/BA2PbI4.h5, entry: entry_0000, frame: 0
analysis.plot_analysis_results(
    matched_params=matched_params,
    entry='entry_0000',  # select entry
    frame_num=0,          # select frame
    clims=(50, 5e2),     # color map
)
Note: The datasets in the NeXus file are modified when peaks are added or deleted.
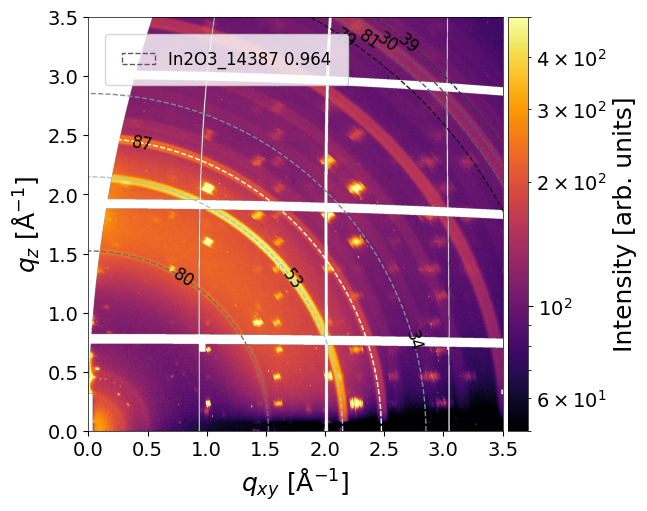
Rings
Repeat the procedure for rings. Visualize the matched rings:
# Visualization settings for matched peaks (multiple structures in solution)
matched_params = {
    'solution': None,              # list of structures to display (None = all)
    'plot_segments': False,         # show matched peak positions
    'marker': ['s', 's', 's'],     # marker shapes for each structure
    'marker_size': [50, 50, 50],   # marker sizes for each structure
    'marker_facecolor': ["none", "none", "none"],  # marker fill colors
    'marker_edgecolor': ["winter", 'blue', 'green'], # marker edge colors per structure
    'plot_rings': True,            # draw matched rings
    'line_width': [1, 1, 1],       # line widths for each structure
    'line_style': ["--", "--", "--"], # line styles for each structure
    'line_color': ["bone", 'blue', 'bone'], # line colors per structure
    'plot_id': True,              # display peak IDs
    'text_color': 'black',         # color of ID labels
    'text_size': 12,                # font size of ID labels
    'legend': True,                # show legend for multiple structures
    'plot': True,                 # enable/disable plotting of matched peaks
}

# Plot analysis results with selected matched peak visualization
analysis.plot_analysis_results(
    matched_params=matched_params,
    entry='entry_0000',  # select entry
    frame_num=0,          # select frame
    clims=(50, 5e2),     # color map
)

Delete the peak #17
analysis.delete_peak(
    entry='entry_0000',
    frame_num=0,
    peak_id=17
)
Plot:
analysis.plot_analysis_results(
    matched_params=matched_params,
    entry='entry_0000',  # select entry
    frame_num=0,          # select frame
    clims=(50, 5e2),     # color map
)
Add a ring box:
analysis.add_peak(
    entry='entry_0000',
    frame_num=0,
    angle=45,       # angular center of the box (in deg). 45 for rings.
    angle_width=90, # angular width of the box (in deg). 90 for rings.
    radius=2.5,     # radial center of the box (Å⁻¹).
    radius_width=0.05, # radial width of the box (Å⁻¹)
)
INFO - Peak id#93 has been added
Run fitting and matching:
analysis.run_fitting()
analysis.run_matching(
    cif_prepr = r'../../example/prepr_cifs.pickle',
    peaks_type='segments')

analysis.run_matching(
    cif_prepr = r'../../example/prepr_cifs.pickle',
    peaks_type='rings')
INFO - Saved fitted peaks to file: ../../example/BA2PbI4.h5, entry: entry_0000, frame: 0
INFO - cif_prepr is already set. The previous cif_prepr is to be used
INFO - Saved matched peaks to file: ../../example/BA2PbI4.h5, entry: entry_0000, frame: 0
INFO - cif_prepr is already set. The previous cif_prepr is to be used
INFO - No solutions for (../../example/BA2PbI4.h5, entry: entry_0000, frame: 0) was found. Try to decrease threshold
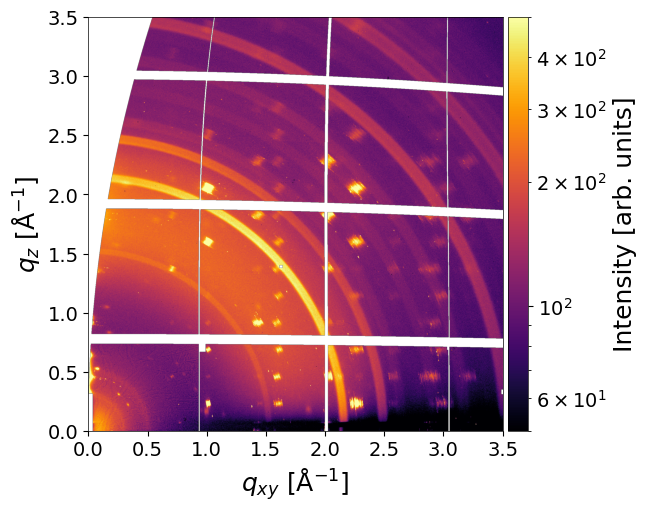
Plot:
analysis.plot_analysis_results(
    matched_params=matched_params,
    entry='entry_0000',  # select entry
    frame_num=0,          # select frame
    clims=(50, 5e2),     # color map
)
Peak tracking with mlgidBASE
The track_peaks method in mlgidBASE provides functionality for temporal tracking of fitted peaks across frames using an IoU-based graph construction approach. Peaks are linked between frames based on geometric overlap in polar space, and resulting trajectories are extracted as connected components of a graph.
First, load the dataset and initialize the analysis object:
from mlgidbase import mlgidBASE

filename = '../../example/BA2PbI4.h5'
analysis = mlgidBASE(filename=filename)
Peak tracking is performed using the track_peaks method. The method requires a similarity threshold (IoU), a minimum track length, and a choice of physical quantity to be extracted along the trajectories.
plot_params = {
    'plot_result': False,              # enable visualization of tracked peaks
    'save_fig': False,               # save figure to disk
    'path_to_save_fig': 'peak_tracking.png',  # output path (if saving enabled)
    'line_width': 1,                 # line width for tracks
    'line_style': 'o-',              # line style for trajectories
    'marker_size': 3,                # marker size for peak points
}

axis_arr, amplitude, frame_num = analysis.track_peaks(
    threshold=0.1,     # IoU threshold for peak connectivity
    length=1,         # minimum number of linked frames per track
    axis='q_z',        # quantity to extract along trajectories
    plot_params=plot_params
)
Output
The method returns:
axis : list[ndarray] – List of arrays with the selected tracked quantity corresponding to all peak instances.
amplitude : list[ndarray] – List of arrays with corresponding amplitudes values for all tracked peaks.
frame_num : list[ndarray] – List of arrays with frame numbers where peak are present.
Notes on tracking algorithm
Peaks are represented as bounding boxes in
(angle, radius)space.Pairwise overlap is quantified using Intersection over Union (IoU).
A graph is constructed where edges correspond to IoU ≥ threshold.
Connected components of the graph define peak trajectories.
Only tracks with length ≥
lengthare retained.
Separate visualization:
import matplotlib as plt
for i in range(len(axis_arr)):
    plt.scatter(frame_num[i],axis_arr[i])